
 한국어
한국어  English
  日本語
日本語  Tiếng Việt
  简体中文
简体中文 
154월2024
업계 리뷰 / 최신 뉴스 및 보고서
댓글: 댓글 없음.
2010년 베트남의 GDP는 일본의 38분의 1에 불과했습니다. 2020년에는 약 14배 높은 수준이 되었으며, 2022년에는 약 12배 높은 수준에 근접할 것으로 보입니다. 이번에는 이를 “성장”의 관점에서 비교하기로 했습니다. 기업이 향후 사업 활동을 검토할 때 “새로운 수요가 어떻게 창출될 것인가”가 더 중요한 경우가 많기 때문입니다.
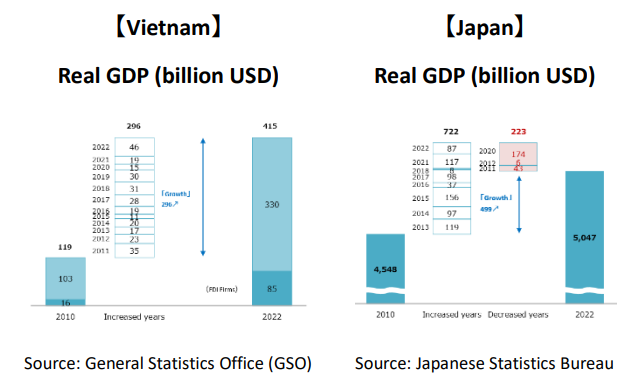 실질 GDP를 살펴보면, 베트남은 2010년부터 2022년까지 연도별 변동은 있었지만 꾸준한 성장세를 보인 반면, 일본의 성장은 더욱 불규칙했습니다. 코로나의 영향뿐만 아니라, 엔화 약세가 나타난 2020년을 포함해 일본은 미국 달러 기준으로 세 차례 마이너스 성장을 기록했습니다. 그 결과 12년 동안 일본의 성장은 약 4,990억 USD, 베트남은 약 2,960억 USD로, 일본의 약 60% 수준이었으며 “성장” 측면에서는 같은 규모의 수준이라고 할 수 있습니다. 이 GDP “성장”의 약 23%는 FDI 기업에서 발생했습니다. 기업의 해외 투자는 부가가치 창출을 직접적인 목적으로 하지는 않지만, 사업 활동 이전이라는 측면에서는 일정 수준의 성과를 나타냅니다.
현재 이미 베트남 시장에 진출한 일본 기업 수는 약 2,900개로, 일본 기업 1,000개당 약 1개사에 해당합니다. 이들의 매출을 현지 기업과 비교하면 평균적으로 약 5배 높습니다. 사업 확장에는 어려움과 위험이 따르고 다른 국가 기업과의 경쟁도 치열한 경우가 많지만, 많은 경우 일본에 머물렀을 때보다 더 큰 성과를 거둘 수 있는 것으로 나타납니다.
 국민소득과 소매판매에서도 유사한 “성장” 비교가 가능합니다. 여기서는 국민소득에 대한 결과를 제시합니다. 일본의 “성장”은 여전히 상대적으로 커서 베트남의 약 3배에 달했습니다.
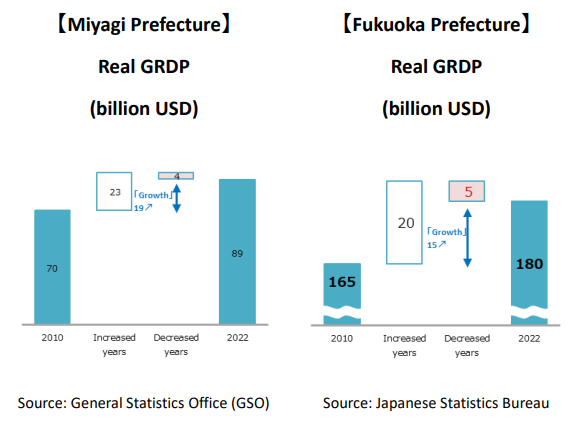
 다음은 지방자치단체 단위의 비교입니다. 도쿄는 규모가 너무 크기 때문에 다른 도도부현과 베트남의 두 주요 도시를 비교했습니다. 확인된 몇 가지 사례 중에는 각각 규슈와 도호쿠를 대표하는 후쿠오카현과 미야기현이 있습니다. 하노이와 호찌민시 및 그 주변을 포함하는 경제권의 성장 잠재력이 어느 정도인지 확인할 수 있었습니다. 일본에서는 미야기현이 높은 성장세를 보였지만, 베트남의 각 성과 도시의 “성장”이 더 컸습니다. (연도별 내역은 다음 그래프에서 생략합니다.)

 마지막으로 산업별로 살펴보겠습니다. 물론 국가마다 분류 기준이 동일하지 않으므로 이는 참고용으로만 보아야 합니다.
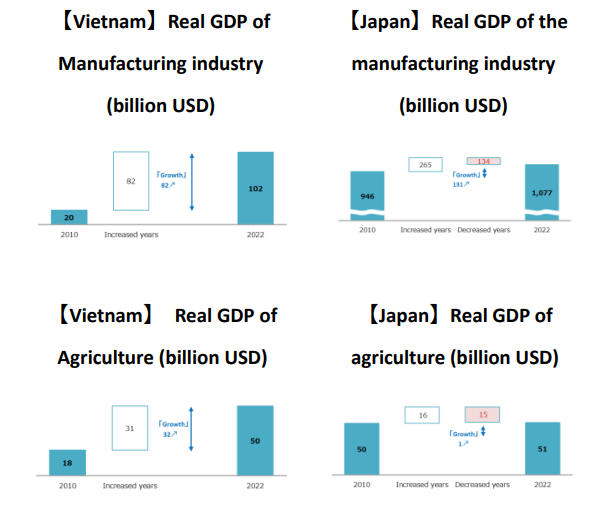
 농업은 일본이 성장하지 않고 있기 때문에 “성장”이 아니라 전체 규모 측면에서도 역전될 가능성이 높습니다. 제조업과 유통업 역시 일본보다 몇 배나 큰 규모는 아니지만, 같은 규모의 수준에 있습니다. 베트남은 이제 초대형 기업을 제외하면 일본 기업에 “너무 작은” 시장이 아닙니다
베트남의 GDP – B&Company
이 기사는 ASEAN Economic News의 "베트남 동향 읽기" 칼럼에 게재되었습니다. 자세한 내용은 아래를 참조하세요.