As Vietnam navigates a shifting global trade landscape, the U.S.’s reciprocal tariff scheme presents both challenges and opportunities.

18Aug2025
Latest News & Report / Vietnam Briefing
Comments: No Comments.
Vietnam’s trade landscape is undergoing a pivotal transformation amidst shifting global dynamics. Following a strong rebound in 2024, the introduction of U.S. reciprocal tariffs in 2025 brought immediate disruptions and exposed long-term vulnerabilities in the country’s export-driven economy. While the government has successfully negotiated a trade deal with the U.S., concerns over transshipment have underscored the urgency of industrial localization, export market diversification, and stricter traceability enforcement. These structural shifts signal both emerging opportunities and growing risks that foreign investors must closely monitor when assessing the Vietnamese market.
Overview of Vietnam’s Trade Landscape
Vietnam’s trade performance experienced notable shifts in recent years. The country had maintained a steady growth rate in trade volume since 2009[1], with notable surges in 2021 and 2022. However, 2023 marked the first annual decline in over a decade, as geopolitical tensions and high inflation dampened global demand for Vietnam’s manufactured goods[2]. However, signs of recovery started in late 2023 and carried on in 2024, helping Vietnam’s total trade volume rebounded to 786 billion USD with a year-over-year growth of 16%. Exports surpassed 400 billion USD (up 14% YoY), accounting for 2% of global trade[3], while imports also grew by 17% to over 380 billion USD, a turnaround from the 10% contraction in 2023. The foreign-invested sector remains a key driver, contributing over two-thirds of total trade and generating a surplus of more than 50 billion USD. This offset the domestic sector’s deficit, resulting in an overall trade surplus of 25 billion USD[4].
Vietnam Export and Import Situation, from 2015 to Q2 2025
Unit: Billion USD
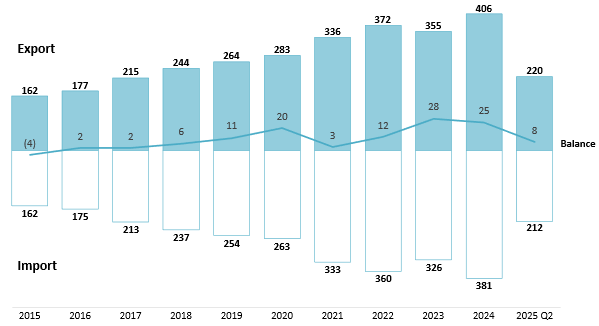
Source: Statistical Yearbooks of Vietnam, National Statistics Office, B&Company’s synthesis
Vietnam’s trade performance in 2024 was marked by strong export growth of manufactured goods and a steady rebound in imports driven by rising demand for production inputs. Ten key export items, which account for over 75% of export value, posted positive growth, with six recording double-digit increases. Notably, computers, electronics, and components, the country’s top export, grew by 27% year-over-year, representing 18% of total export value. Regarding imports, capital goods comprised 94% of total imports, up from 89% in 2023[5]. Imports of machinery, parts, and components rose by 28%, while raw material imports increased by 18%, signaling heightened industrial activity and supply chain replenishment. However, it also highlight Vietnam’s heavy reliance on imported intermediate inputs for key export sectors, such as electrical and optical equipment (97%), footwear (83%), and textile products (77%)[6].
Export and Import Structure of Vietnam in 2024
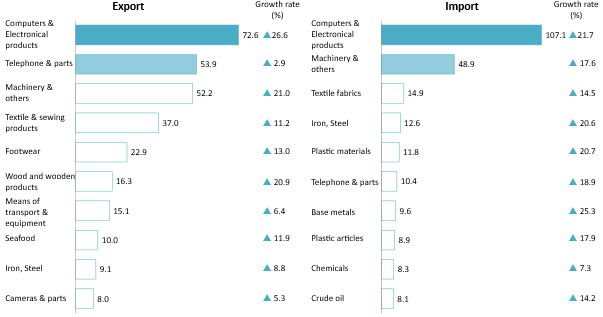
Source: Statistical Yearbooks of Vietnam, National Statistics Office, B&Company’s synthesis
The trade landscape of Vietnam in 2024 was shaped by deepening ties with key global partners:
– China: China remained Vietnam’s largest partner with a total trade volume of over 200 billion USD. The country is a critical supplier of input components for Vietnam’s manufacturing and processing industry, representing nearly 87% of the imported telephones and parts, 60% of the imported machinery, and over 30% of the imported computers, electronics, and parts.
– The U.S. is Vietnam’s largest export market, with a total value of exported goods in 2024 reaching 120 billion USD.
– Trade activity also recovered with other key partners, including Korea, Japan, and ASEAN, with total trade volumes growing by 14%, 7%, and 2%, respectively. Notably, the E.U. has risen to be Vietnam’s critical trade partner since the implementation of the EVFTA in 2020. In 2024, trade with the EU grew by 16%, making it Vietnam’s third-largest export market and a major buyer of coffee (38%) and footwear (25%).
Vietnam’s bilateral trade landscape with important partners in 2024
Unit: Billion USD
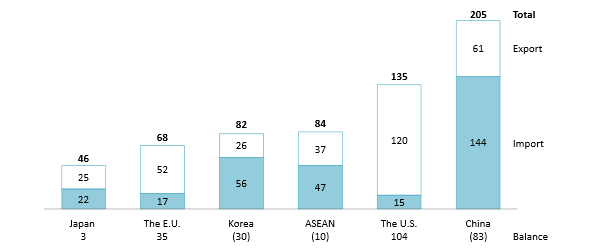
Source: Statistical Yearbooks of Vietnam, National Statistics Office, B&Company’s synthesis
Vietnam-U.S. Bilateral Trade and The U.S.’s Tariff Plan in 2025
The Vietnam-U.S. trade relationship between the two countries has grown significantly over a decade, positioning the U.S. as Vietnam’s largest export market. Bilateral trade has expanded at a CAGR of 16% since 2010, reaching 135 billion USD in 2024. Vietnam’s exports made up the majority of the trade volume at 120 billion USD, with the U.S. being a prominent market for computers and electronics, machinery, textiles, etc. In contrast, imports from the U.S. experienced modest growth with a CAGR of 3% between 2018 and 2024. Consequently, Vietnam’s trade surplus with the U.S. has steadily widened, quadrupling since 2015, leading to heightened scrutiny and trade tensions.
Table 1: Major Vietnam’s Exports to the U.S. by product category in 2024
| No. | Category | Export value
(Unit: Billion USD) |
Share of
Export of goods (Unit: %) |
Share of
Export to the U.S. (Unit: %) |
| 1 | Computers, electronic products & parts | 23.2 | 32.0 | 19.4 |
| 2 | Machinery, instrument, accessory | 22.1 | 42.3 | 18.5 |
| 3 | Textile, sewing products | 16.2 | 43.6 | 13.5 |
| 4 | Telephones and their parts | 9.8 | 18.2 | 8.2 |
| 5 | Wood and wooden products | 9.1 | 55.6 | 7.6 |
Source: National Statistics Office, B&Company’s synthesis
On April 2nd, 2025, U.S. President Donald Trump announced a reciprocal tariff of 10% on all imports, along with higher tariffs targeting nations with significant trade surpluses, effective from April 5th [7]. A 46% tariff rate was imposed on Vietnam, which is among the highest applicable rates, citing the trade deficit and concerns over Chinese goods being rerouted to bypass tariffs. Following three negotiation rounds, President Trump announced on July 2nd that the U.S. and Vietnam had reached a trade agreement, making Vietnam the third nation to secure a deal with Washington. On July 31st, the U.S. announced its adjustments to the reciprocal tariff rates, with Vietnam being imposed a 20% tariff rate, and transhipped goods facing a 40% rate, which is to become effective after 7 days[8].
Table 2: Adjusted Reciprocal Tariff Rates on July 31st of Vietnam and Other Notable Countries[9]
| No. | Country | Reciprocal Tariffs – Announced April 2nd
(Unit: %) |
Reciprocal Tariffs –
Effective August 1st (Unit: %) |
| 1 | China | 34[10] | 55 |
| 2 | Vietnam | 46 | 20 |
| 3 | Japan | 24 | 15 |
| 4 | Korea | 25 | 15 |
| 5 | Taiwan | 32 | 20 |
| 6 | India | 26 | 25 |
| 7 | Malaysia | 24 | 19 |
| 8 | Indonesia | 32 | 19 |
| 9 | Laos | 48 | 40 |
| 10 | Cambodia | 49 | 19 |
| 11 | Thailand | 36 | 19 |
Source: Executive Order 14257 and The White House, B&Company’s synthesis
Impacts and Implications of the U.S. Tariff Scheme for Vietnam
a. The immediate disruptions
The announcement of elevated U.S. tariffs had an immediate and disruptive impact on Vietnam’s economy, particularly its export-driven manufacturing sector. The country’s Purchasing Managers’ Index (PMI)[11] fell sharply from a seven-month high of 50.5 in March 2025 to 45.6 in April, driven by a drop in new export orders amidst tariff uncertainty[12]. Although a more stable environment in May provided a brief recovery, weakening foreign demand contributed to a continued contraction in the manufacturing sector throughout the second quarter.
However, it should be noted that manufacturing output grew in both May and June[13] as U.S. importers accelerated orders ahead of the anticipated tariff reinstatement in July 2025[14]. Consequently, in the first 6 months, exports of Vietnam to the U.S. reached 71 billion USD, a year-over-year increase of 28%[15], with May’s exports reached a post-pandemic high of 14 billion USD[16].
Notable Vietnam – U.S. Trade Events and Economic Indicators (As of August 1st, 2025)
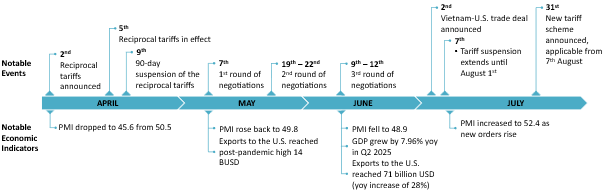
Source: National Statistics Office, World Bank, B&Company’s synthesis
b. Vietnam’s trading landscape under the Vietnam-U.S. trade deal
Despite the increased tariff rate, the country’s rate remains relatively competitive compared to other manufacturing hubs, enabling it to retain a strong position in the U.S. market. While firms heavily reliant on the U.S. may consider relocating production, Vietnam continues to appeal to foreign investors with diversified market exposure. Its expanding manufacturing base, coupled with an extensive network of FTAs, and efforts to strengthen domestic capabilities and supporting industries[17], presents a favorable long-term investment environment. EuroCham reports that business sentiment remains largely optimistic, with 43% of companies expecting improved conditions in Q3 2025 and 78% expressing confidence in the five-year outlook.
c. Implications for businesses
The elevated tariff rate and the U.S.’s concern over transhipped goods have shifted the business sentiments of manufacturing companies domestically, forcing companies to adopt new strategies:
– Export diversification: Reports[18] [19] have indicated that manufacturing and export companies are looking for potential new markets in response to the U.S.’s trade measures. Businesses targeting high-standard markets like the E.U., Japan, and the U.K. should prioritize upgrades in product quality, traceability, and value-added capacity to seize emerging opportunities amid global supply chain realignments.
– Sourcing diversification: Companies are also proactively diversifying sourcing to other countries to reduce reliance any particular trade partners.
– Localization of supply chain: While transshipment accounts for only 16% of Vietnam’s exports to the U.S.[20], past negotiations indicate that transshipped goods may extend to products containing a high proportion of foreign components with minimal value added by Vietnamese manufacturers. This pushes domestic producers to move beyond low value-added processing and engage more deeply in the supply chain through design, component manufacturing, and technology-intensive production stages.
– Operational efficiency improvement: As profit margin threatens under the new tariff scheme, companies are looking to improve production efficiency, such as implementing automation, reducing waste materials, etc.
– Strengthening trade compliance: As Vietnam moves toward stricter enforcement of rules of origin to prevent transshipment, early adopters of localized production, traceability, and value-added manufacturing will gain a competitive edge. Proactive compliance not only reduces trade risks but also unlocks preferential tariffs under Vietnam’s extensive FTA network.
Conclusion
As Vietnam navigates a shifting global trade landscape, the U.S.’s reciprocal tariff scheme presents both challenges and opportunities. Elevated tariffs highlight the urgent need to strengthen domestic industrial capabilities, reduce dependence on imported inputs, and meet stricter trade compliance standards. At the same time, Vietnam’s favorable tariff position, expanding FTA network, and targeted government incentives open new avenues for investment in resilient, diversified supply chains.
[1] VCCI. Vietnam’s Trade and Investment Landscape in 2023 <Access>
[2] WTO. Annual Report 2024 <Access>
[3] WTO. Global Trade Outlook and Statistics – April 2025 <Access>
[4] NSO. The picture of Vietnam’s import and export goods in 2024 – Recovery, development, and new records <Access>
[5] NSO. Vietnam Statistical Yearbook – 2023 <Access>
[6] ADB. Viet Nam: Input-Output Economic Indicators <Access>
[7] Federal Register. Presidential Document: Regulating Imports with a Reciprocal Tariff to Rectify Trade Practices that Contribute to Large and Persistent Annual United States Goods Trade Deficits <Access>
[8] White House. Executive Order: Further Modifying the Reciprocal Tariff Rates <Access>
[9] Countries were selected if they are major FDI investors in Vietnam, global competitors, or neighboring countries.
[10] The reciprocal tariffs shown are from the April 2nd announcement, which was escalated to 145% in the following months.
[11] S&P Global Manufacturing Purchasing Managers’ Index (PMI) measures the performance of the manufacturing sector and is derived from a survey on 5 indicators: new orders, output, employment, suppliers’ delivery times, and purchased stock of items. A reading above 50 indicates an expansion of the manufacturing sector compared to the previous month; below 50 represents a contraction; while 50 indicates no change.
[12] S&P Global. S&P Global Vietnam Manufacturing PMI <Access>
[13] Vietnam’s Industrial Production Index, which evaluates the growth pace of industrial production, highlights that manufacturing output grew month-over-month by 3.8% in May and 5.1% in June <Access>
[14] Vietnam Investment Review. Exporters attempt to make the most of the US tariff impasse <Access>
[15] VnEconomy. Vietnam’s Trade Surplus Reaches USD 7.63 Billion in First Half of 2025, Exports and Imports Up 16.1% <Access>
[16] Vietnam Customs. Preliminary Overview of Vietnam’s Import and Export Activities in the Second Half of May 2025 <Access>
[17] MoIT. Seeking solutions for the development of supporting industries <Access>
[18] VnExpress. Vietnamese Enterprises Shift in Response to Tariff Risks <Access>
[19] PwC. US Tariff Policies: Impact and Pathways for Vietnam’s Manufacturing Businesses <Access>
[20] Techcombank. Quick Assessment of the U.S.–Vietnam Trade Negotiation Outcomes <Access>
* If you wish to quote any information from this article, please kindly cite the source along with the link to the original article to respect copyright.
| B&Company
The first Japanese company specializing in market research in Vietnam since 2008. We provide a wide range of services including industry reports, industry interviews, consumer surveys, business matching. Additionally, we have recently developed a database of over 900,000 companies in Vietnam, which can be used to search for partners and analyze the market. Please do not hesitate to contact us if you have any queries. info@b-company.jp + (84) 28 3910 3913 |
Related article


Sidebar:
SUBSCRIBE NEWSLETTER