
 한국어
한국어  English
  日本語
日本語  Tiếng Việt
  简体中文
简体中文 
154월2024
업계 리뷰 / 최신 뉴스 및 보고서
댓글: 댓글 없음.
In 2010, Vietnam’s GDP was one-38th of Japan’s. By 2020, it was about 14 times higher, and by 2022, it will be closer to 12 times higher. This time, we decided to compare this in terms of “growth”. This is because “how new demand will be created” is often more important when companies consider their future activities.
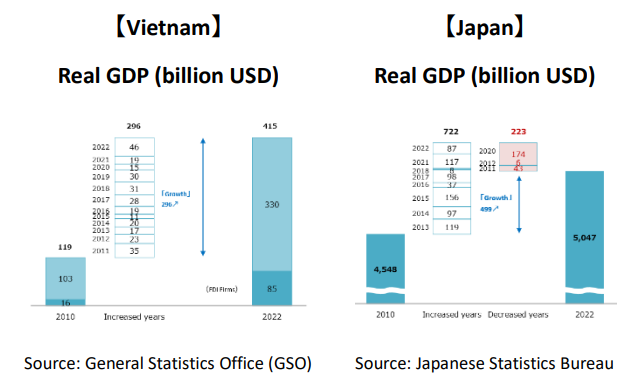 Looking at real GDP, Vietnam has shown steady growth between 2010 and 2022, with annual fluctuations, while Japan’s growth has been more uneven. In addition to Corona, Japan was negative in U.S. dollar terms three times, including in 2020 when the yen weakened. As a result, over the 12-year period, Japan’s growth was about 499 billion USD while Vietnam’s was about 296 billion USD, about 60% of Japan’s, or the same order of magnitude in terms of “growth”. About 23% of this GDP “growth” came from FDI firms. Although foreign investment by enterprises is not aimed at adding value, it does represent a certain level of results in terms of the transfer of business activities.
Now, the number of Japanese companies that have already entered the market is about 2,900, or about one in every 1,000 Japanese companies. Comparing their sales to those of domestic companies, the average is about five times higher. Although there are difficulties and risks involved in expanding, and competition with companies from other countries is often fierce, in many cases the fruits can be seen as greater than if they had remained in Japan.
 Similar “growth” comparisons can be made for national income and retail sales. Here we show the results for national income. Japan’s “growth” was still relatively large, about three times that of Vietnam.
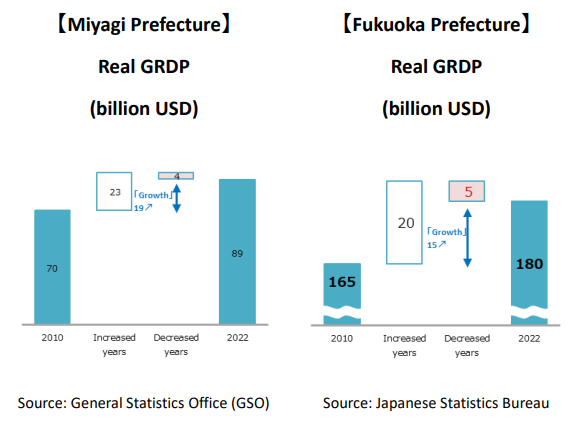
 Next is the unit of local government. Since Tokyo is too large, we compared other prefectures and Vietnam’s two largest cities. Among several confirmed examples are Fukuoka and Miyagi prefectures, which represent Kyushu and Tohoku, respectively. The size of the growth potential of the economic zone including Hanoi and Ho Chi Minh City and their surroundings was confirmed. In Japan, Miyagi Prefecture had the momentum, but the “growth” of each province and city in Vietnam was greater. (Yearly breakdowns are abbreviated in the following graphs.)

 Finally, let’s look at industry. Of course, this is only a guide, as the lines of classification are not the same from country to country.
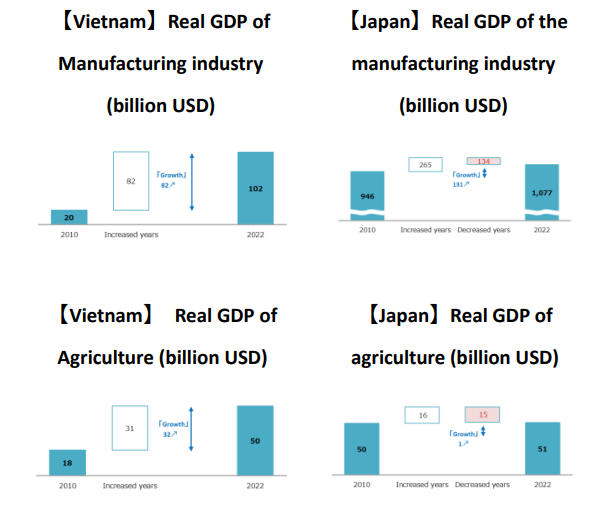
 Agriculture is also likely to reverse, not in “growth” but in overall value, as Japan is not growing. The manufacturing and distribution sectors are also not many times larger than Japan’s, but are in the same order of magnitude. Vietnam is no longer too “small” for Japanese companies except for the very large ones
Vietnam’s GDP – B&Company
이 기사는 ASEAN Economic News의 칼럼 “베트남 트렌드 읽기”에 게재되었습니다. 자세한 내용은 아래를 참조하세요.